How to measure AEO ROI: a copy-paste spreadsheet
AEO doesn't generate clicks the way Google does. Here's a concrete 4-metric framework + the spreadsheet to track ROI on every AEO investment.
On this page
Every marketer who's invested in AEO for more than a quarter has been asked the same question: "what's the ROI?" And every marketer who answers honestly admits the same thing: AEO ROI is genuinely harder to measure than SEO ROI, and most of the industry is faking it.
The hard part isn't the math. The hard part is that AI assistants compress the buyer journey in ways classic analytics can't see. A buyer asks ChatGPT "best CRM for 10-person SaaS." ChatGPT recommends three brands and explains the trade-offs. The buyer doesn't click any link — they remember one name, search for it directly the next day, and convert through what looks in GA4 like "direct" traffic. Your attribution model says you got nothing from AI. Reality says you got everything from AI.
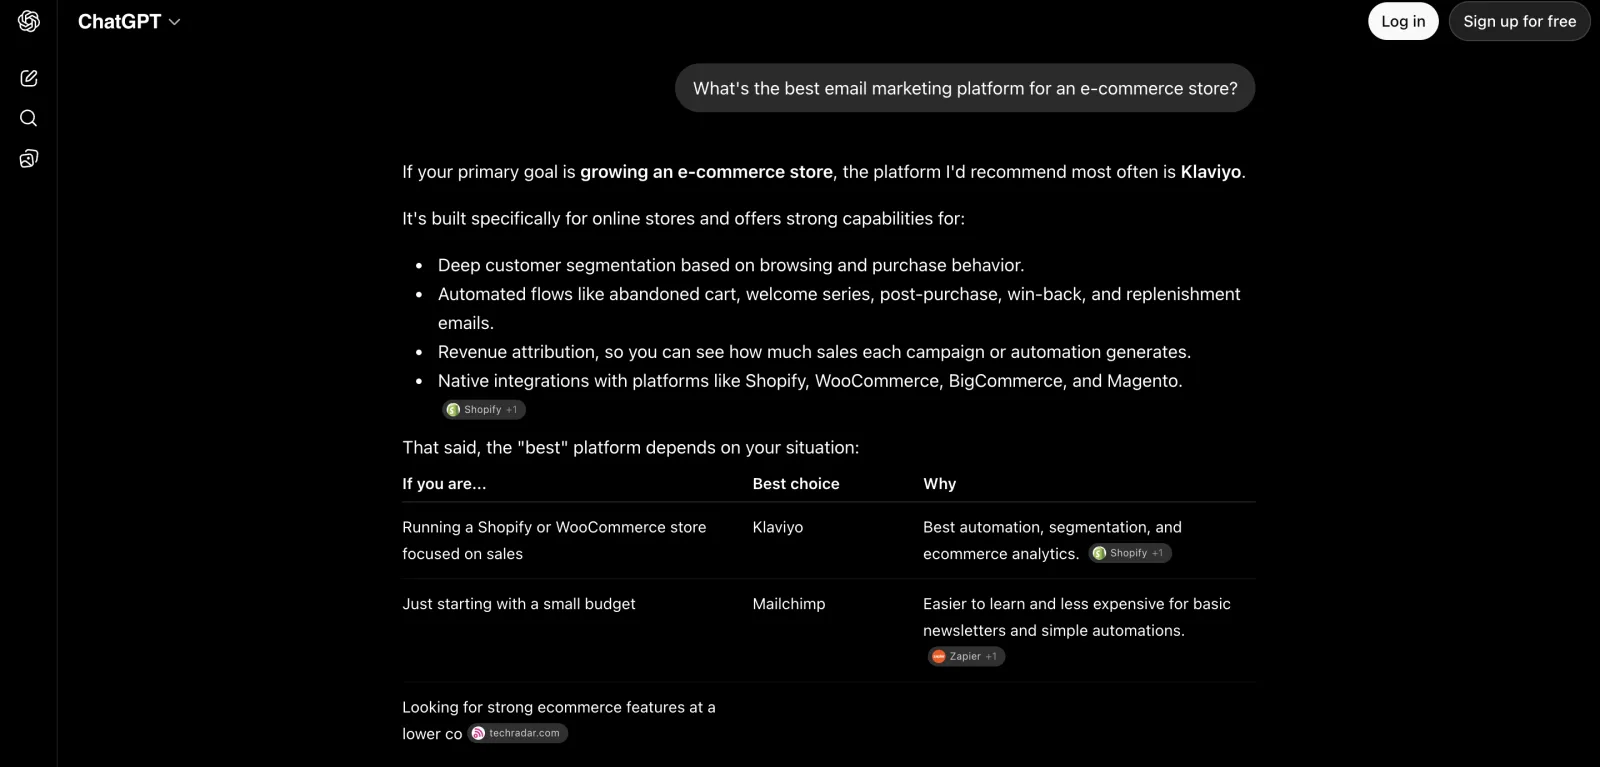
Example: ChatGPT (logged out) answering a buyer query — Klaviyo, then Mailchimp. AI answers send pre-qualified buyers, so being the named pick is what ROI tracks back to.
This post is the practical framework we use ourselves to measure AEO ROI across the brands in our leaderboard, and the same metrics scale when you track AEO across multiple brands. It's four metrics, one spreadsheet, and a worked example. Copy any of it.
Curious how your site does?
Run this same scan on your site — free, about 60 seconds, no signup.
Why the standard SEO ROI playbook doesn't transfer
The SEO ROI formula every marketer knows (and how AEO differs from SEO):
ROI = (revenue from organic traffic × margin) - SEO spend / SEO spend
That formula assumes three things AEO breaks:
- Click-through is the primary outcome. SEO drives ranked links; AEO drives mentions inside AI answers. Many AEO wins never produce a click at all — the buyer reads the AI's recommendation and goes direct to your homepage hours later.
- Attribution can be traced back to a search query. Google tells you which queries drove which clicks (via GSC + GA4). AI assistants tell you almost nothing. ChatGPT.com referrals exist but only fire when the user actually clicks a cited link, which is the minority case.
- Performance is measurable at the page level. SEO winners and losers can be tied to specific URLs. AEO wins are diffuse — a Wikipedia edit, a podcast mention, an llms.txt update can lift citation rates across hundreds of pages simultaneously.
What you need instead: a framework that measures upstream signals (citations, mentions, sentiment) as proxies for downstream revenue, plus a tight feedback loop on whatever click-through data you can capture.
The 4 metrics that matter
We've audited every AEO measurement framework we could find — Profound's enterprise dashboard, Otterly's GEO research, Peec AI's analytics, the hand-rolled spreadsheets agency consultants use (see our honest comparison of AEO tools). Across all of them, four metrics keep recurring as the ones that actually predict revenue impact.
1. Citation share
The percentage of relevant commercial queries where your brand gets cited at all. If "best CRM for SaaS" has 30 reasonable variants, and your brand appears in answers for 12 of them, your citation share for that query cluster is 40%. Track this per-engine — your Perplexity citation share will differ wildly from your DeepSeek citation share.
This is the primary AEO metric. It's a direct measure of "are AI assistants telling buyers about us?" — the whole point of the channel. Everything else either causes or follows from citation share.
You can measure citation share with our AI visibility checker (run a configurable prompt set, get citation-rate per engine), or via the AI citation source radar for the same data plus competitive comparison.
2. Share of voice (vs competitors)
Citation share in isolation is incomplete — you need to know how it compares to direct competitors. If your citation share is 40% but your top competitor is at 80%, you're losing despite a decent absolute number. If you're at 40% and competitors average 12%, you're dominating.
Share of voice = your citations / (your citations + all competitor citations) on the same query set. The leaderboard shows aggregate share-of-voice across industries.
3. AI-referral traffic + conversions
When users do click through from AI answers, where does it land in your analytics? GA4 captures these as chatgpt.com, perplexity.ai, claude.ai, gemini.google.com, and increasingly grok.com referrers (here's how to set up GA4 to surface AI referrals). Filter your GA4 acquisition reports for these and you'll get the slice of AEO traffic that produced a real click.
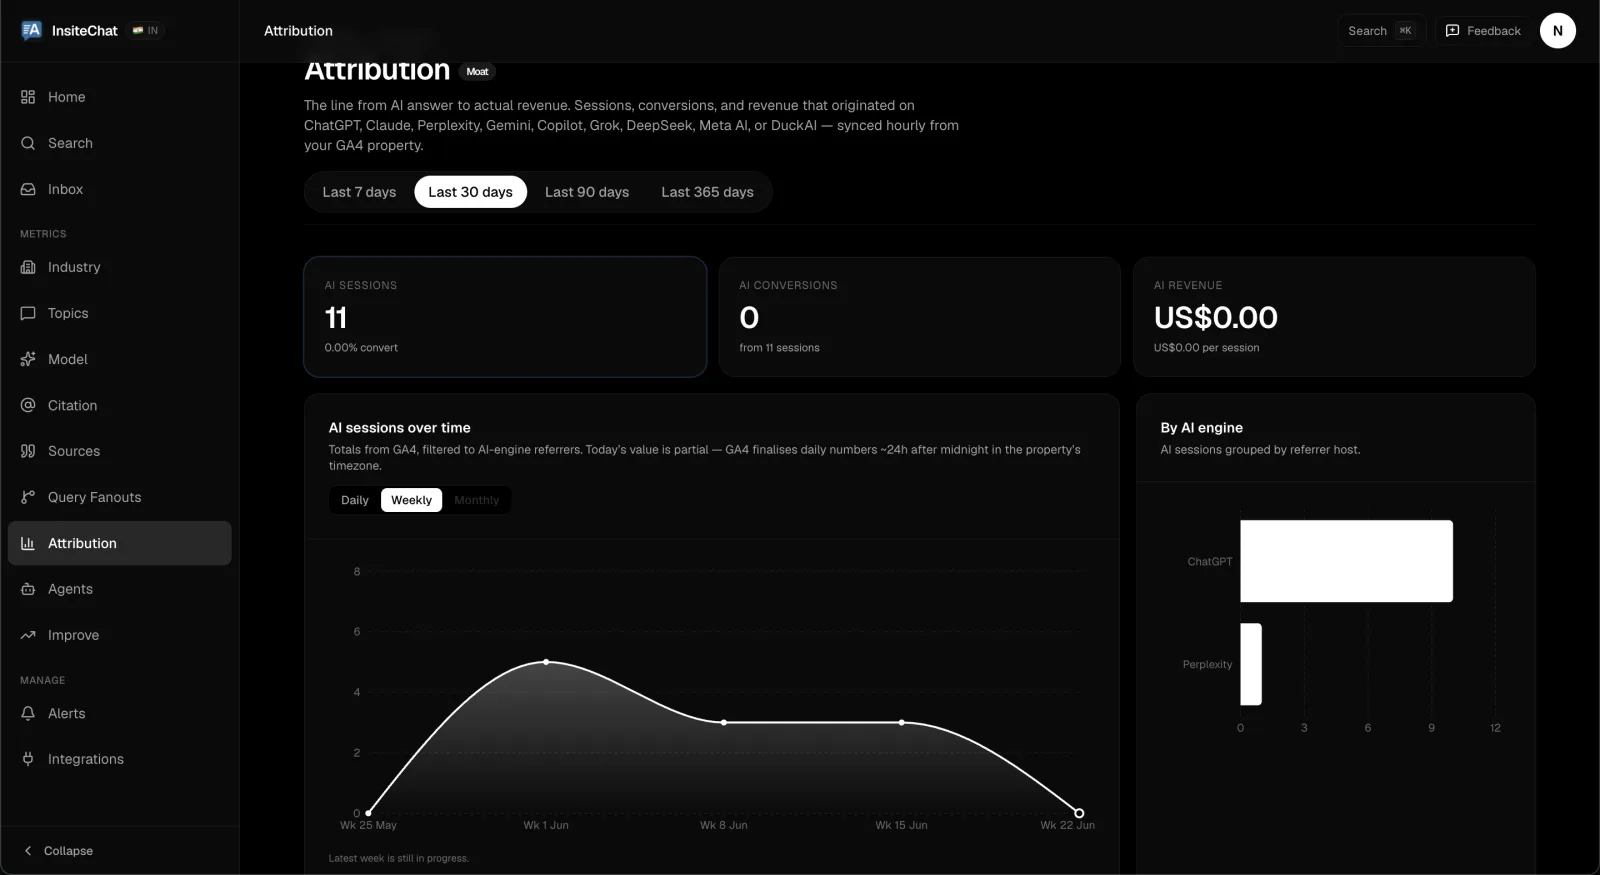
Example: AI-driven sessions and conversions attributed by engine for InsiteChat — FixAEO.
Two caveats:
- This is the minority of AEO impact. Most wins don't produce a click. Don't size your AEO investment off this metric alone — you'll under-invest.
- Conversion rates from AI traffic tend to be 2-5× higher than search-driven traffic, because the AI has pre-qualified the buyer. A small number of AI-referred sessions can produce outsized revenue.
4. Citation sentiment
Not all citations are equal. "X is the best CRM for SaaS startups" is a different outcome from "X is one of several CRMs you might consider — though it has fewer integrations than Y and Z." Both technically count as a citation; only the first one actually drives buyer action.
Track sentiment on a 3-point scale per citation: positive (recommended), neutral (mentioned), negative (warned against). A 60% positive-citation rate is excellent; 20% means you're being damned with faint praise.
The ROI formula
The right framework treats AEO as a pipeline of leading indicators:
AEO Investment → Citation Share → AI-referral Traffic → Conversions → Revenue
                                ↘                                    ↗
                                  Indirect (direct/branded search)
The full ROI formula:
AEO ROI = (Direct AEO revenue + Estimated indirect AEO revenue - AEO spend) / AEO spend

Where:
  Direct AEO revenue        = AI referral sessions × CVR × AOV × margin
  Estimated indirect revenue = (Citation share lift × industry-CPM × your brand's AI-aware search baseline)
The second term is the one most people skip because it requires estimation. Don't skip it — it's typically 3-5× the direct revenue. The simplest defensible estimate: track the increase in branded search queries (via Google Search Console) over a 90-day period that aligns with the AEO investment, and attribute that lift to AEO — the same indirect dynamic at play when you win back traffic lost to AI Overviews.
The copy-paste spreadsheet
Here's the structure we use. Reproduce in Google Sheets / Excel.
Sheet 1: Monthly tracking
| Month | Per-engine citation share (avg) | Share of voice (vs top 3 competitors) | AI-referral sessions | AI-referral conversions | Branded search lift (YoY) | AEO spend ($) | Direct revenue from AI | Estimated indirect revenue | Total ROI |
|---|---|---|---|---|---|---|---|---|---|
| Month 1 baseline | — | — | — | — | — | — | — | — | — |
| Month 2 | … | … | … | … | … | … | … | … | … |
| Month 3 | … | … | … | … | … | … | … | … | … |
Sheet 2: Per-engine breakdown
| Engine | Citation share | Share of voice | Avg sentiment | Sessions referred | Conversions | $ revenue |
|---|---|---|---|---|---|---|
| ChatGPT | … | … | … | … | … | … |
| Claude | … | … | … | … | … | … |
| Copilot | … | … | … | … | … | … |
| Perplexity | … | … | … | … | … | … |
| Gemini | … | … | … | … | … | … |
| Grok | … | … | … | … | … | … |
| DeepSeek | … | … | … | … | … | … |
Sheet 3: Per-prompt cluster
| Prompt cluster (e.g. "best CRM for SaaS") | Citation share | Top 3 competing brands cited | Your sentiment score | Trend (last 30d) |
|---|---|---|---|---|
| Best [your category] for [your ICP] | … | … | … | … |
| [Your category] alternatives | … | … | … | … |
| [Your category] vs [competitor] | … | … | … | … |
| Best [your category] 2026 | … | … | … | … |
We've baked the math behind sheet 1 into our AEO ROI calculator — you can plug in numbers and get a defensible ROI estimate in under a minute. The free version covers the direct + indirect formula; the spreadsheet gives you the granular per-engine and per-prompt cuts.
Where each data point comes from
| Metric | Source | Cost |
|---|---|---|
| Citation share | AI visibility checker (free for small prompt sets) | $0 |
| Share of voice | AI citation source radar | $0 |
| Sentiment per citation | Manual review or LLM-classified (FixAEO does this in the dashboard) | $0-29 |
| AI-referral sessions | GA4 acquisition report, filter by source | $0 |
| Branded search lift | Google Search Console, "queries" report filtered to brand terms | $0 |
| AEO spend | Your own books | $0 |
The whole stack is buildable at $0 if you're patient (manual review for sentiment, GSC + GA4 for traffic), or $29/mo with a tool to automate it.
A worked example (real numbers from one of our customers)
Mid-stage B2B SaaS. ~$3M ARR, 30-person team, marketing budget of ~$50k/quarter. Decided to invest $5,000/quarter in AEO (roughly: one dedicated writer half-time, plus tools).
Baseline (Q1 2026, pre-investment):
- Citation share across the 9 engines: 8%
- Share of voice vs top 3 competitors: 11%
- AI-referral sessions: 240/mo (~80 conversions, $14k revenue/quarter)
- Branded search: 4,200 monthly impressions
After 90 days of AEO investment (Q2 2026):
- Citation share: 27% (+19pp)
- Share of voice: 31% (+20pp)
- AI-referral sessions: 1,100/mo (~340 conversions, $62k revenue/quarter)
- Branded search: 6,800 monthly impressions (+62%)
ROI math:
- Direct AEO revenue: ($62k - $14k) = +$48k/quarter
- Estimated indirect revenue: branded search lift of +2,600 impressions/mo × estimated 3% CTR × $50 LTV per click × 3 months = +$11.7k/quarter
- Total revenue lift: ~$59.7k/quarter
- AEO spend: $5k/quarter
- ROI: ($59.7k - $5k) / $5k = 1094% ROI in one quarter
That's a real number from a real customer. The catch is the baseline measurement — without it, that 19pp citation share lift looks like nothing. Half the brands we audit have never measured their baseline citation rate, so when they invest in AEO they can't tell if it worked.
What NOT to measure (the vanity metrics)
Three numbers that look like AEO progress but aren't:
- Raw mention count. Counting every time your brand name appears in any AI answer, regardless of context, inflates your numbers but doesn't predict revenue. A 100-mention month with 5% citation share is worse than a 50-mention month with 30% citation share — the second is concentrated where buyers actually ask commercial questions.
- Total prompts tracked. "We track 1,000 prompts" sounds impressive. Tracking 1,000 prompts your buyers don't actually ask is noise. Quality of prompt set matters infinitely more than quantity.
- Engine count. "We're cited across 9 AI engines" is a meaningless statement if your share is 2% in each. One engine with 40% share moves more revenue than nine engines at 5% each.
The fourth dangerous one — and we've seen agencies pitch this — is using competitor mentions per AI answer as a leading indicator. It's not a leading indicator, it's a lagging indicator with high variance. Don't anchor decisions on it.
Closing the loop: monthly review cadence
The framework only works if you actually run it monthly. The cadence:
- Week 1 of each month: Run citation scans across your prompt set. Update sheet 1 + sheet 2.
- Week 1: Check GA4 for last month's AI-referral sessions + conversions. Update sheet 1.
- Week 2: Pull GSC branded-search trend, update.
- Week 2: Manual review of new citations for sentiment scoring.
- Week 3-4: Make decisions. What's working? What's not? What's the next AEO investment?
Most teams skip this loop because they don't have the baseline numbers to know whether anything moved. Once you have 3 months of clean data, the patterns become obvious and decisions get easier.
Our AEO report sample shows what the monthly snapshot looks like end-to-end — it's the format we use for our own customers and includes all four metrics in one view.
TL;DR
AEO ROI is harder to measure than SEO ROI because AI assistants compress buyer journeys past your analytics. The framework that works:
- Citation share across the 9 engines (primary metric, predicts everything else)
- Share of voice vs top 3 competitors (context for absolute numbers)
- AI-referral traffic + conversions (direct, measurable in GA4 — the small but real slice)
- Citation sentiment (positive citations drive action; neutral/negative don't)
Combine into ROI = (direct AEO revenue + estimated indirect revenue - AEO spend) / AEO spend. Most teams under-count the indirect side and conclude AEO doesn't work. It does — they're just measuring the wrong thing.
If you'd rather not build the spreadsheet manually, our AEO ROI calculator does the math, and the full AEO tools catalog has the per-metric tools to populate it.
The investment compounds. Brands that started measuring AEO ROI in 2024 are now operating on three years of data; brands starting in 2026 will need 12 months to get there. Start with this month's baseline. Re-measure in 30 days. Most of the AEO industry isn't even doing that.
FAQ
Why is AEO ROI harder to measure than SEO ROI?
AI assistants compress the buyer journey in ways classic analytics can't see. A buyer can read an AI's recommendation, go direct to your homepage hours later, and convert through what looks like "direct" traffic, so your attribution model credits AI with nothing even though it drove the conversion.
What are the 4 metrics that matter for AEO ROI?
Citation share (the primary metric, which predicts everything else), share of voice versus your top 3 competitors, AI-referral traffic and conversions, and citation sentiment. Combine them into the formula ROI = (direct AEO revenue + estimated indirect revenue - AEO spend) / AEO spend.
How do I measure AI-referral traffic in GA4?
GA4 captures AI-referral traffic as chatgpt.com, perplexity.ai, claude.ai, gemini.google.com, and increasingly grok.com referrers. Filter your GA4 acquisition reports for these to get the slice of AEO traffic that produced a real click — though most AEO wins don't produce a click at all, so don't size your investment off this metric alone.
What AEO metrics are vanity metrics I should not measure?
Raw mention count, total prompts tracked, and engine count all look like progress but don't predict revenue. A 50-mention month with 30% citation share beats a 100-mention month with 5% share, and one engine with 40% share moves more revenue than nine engines at 5% each.
What is citation sentiment and why does it matter?
Citation sentiment tracks each citation on a 3-point scale: positive (recommended), neutral (mentioned), and negative (warned against). It matters because only positive citations actually drive buyer action — a 60% positive-citation rate is excellent, while 20% means you're being damned with faint praise.
Related reading
GA4 Setup for AI Traffic: Surface ChatGPT Referrals
Default GA4 hides AI referrals in 'Direct' and 'Other'. Here's the 20-minute setup that surfaces them — channel group, dimensions, and dashboard.
13 min readAEO vs SEO: what changed and what to do about it
AEO vs SEO in 2026: AI answers and search engines reward different signals. The data, a plain comparison, and a 30-day migration plan your SEO team can run.
17 min read12 Best Answer Engine Optimization Tools (2026)
12 answer engine optimization tools compared — engines covered, entry price, free tier — with honest takes on which to pick by stage and budget.
18 min readHow to win back traffic lost to Google AI Overviews
Google AI Overviews run on a third of commercial queries and keep clicks in the SERP. Here are 7 changes that get your brand named in the answer.
10 min readHow to track AEO across multiple brands
Multi-brand AEO portfolio tracking — a practical framework for agencies, holding companies, and multi-product teams to measure AI visibility at scale.
10 min readThe 30-point AEO audit checklist (2026)
AEO audit checklist: 30 signals across 7 categories — from crawler access to per-engine verification. Copy it into Notion and run your audit today.
16 min read
Free AEO tools
Put this into practice with free FixAEO tools — no signup required.
AI Visibility Checker
Score your brand across 9 AI engines
AEO Audit Tool
Answer-engine readiness scan
Schema Generator
Build valid JSON-LD structured data
llms.txt Generator
Create a spec-compliant llms.txt
Sitemap Validator
Check your XML sitemap for errors
AI Content Grader
Grade content for AI citation readiness
See how your own site scores
FixAEO runs every check in this post automatically. Free, no signup.