How to track AEO across multiple brands
Multi-brand AEO portfolio tracking — a practical framework for agencies, holding companies, and multi-product teams to measure AI visibility at scale.
On this page

Tracking AEO for one brand is straightforward. You watch one Visibility Score, one mentions count, one set of competitor positions. Five brands is a different problem — six dashboards, thirty tabs open, and the very real risk that you average yourself into mediocrity. Portfolio AEO tracking is the practice of rolling up AI visibility across every brand, product, or client you manage into a single view that surfaces signal instead of drowning it.
This post is the framework we use when we look at multi-brand AEO setups. It's the playbook for agencies tracking client rosters, holding companies with sister brands, and SaaS teams running two or three product lines under one roof.
Curious how your site does?
Run this same scan on your site — free, about 60 seconds, no signup.
When does AEO tracking need a portfolio view?
The threshold is lower than people think. You need a portfolio view the moment any of the following is true:
- You manage 3 or more brands or products with distinct domains
- You're an agency with 2+ clients on retainer
- You operate regional sub-brands (e.g. one brand split across US, UK, DE, FR)
- You run a portfolio company structure — holding co. + 3+ operating brands
- You're a D2C parent with multiple product lines that each have their own buyer journey
Below that threshold, a per-brand dashboard is fine. Above it, you start hitting the failure modes below.
What goes wrong when you track multi-brand AEO one tab at a time
Three predictable failures we see when teams try to manage 4+ brands without a portfolio rollup:
- The "which brand should I fix first" problem. Without a single comparable visibility metric, you end up working on whichever brand the loudest stakeholder asked about — not the one that's quietly slipping by 8 percentage points.
- The averaging trap. Teams that do roll up metrics often roll them up wrong — by simple-mean across brands. A 90% Visibility Score on a tiny brand and 20% on a flagship brand averages to 55%, which is meaningless. Weight by response volume.
- Engine drift goes unnoticed. ChatGPT might be citing 4 of your 5 brands while Perplexity cites only 1. Per-brand dashboards hide this. A portfolio view across engines surfaces it in seconds.
The four metrics that scale across a portfolio
Most marketing dashboards have 20 metrics. A useful portfolio AEO view has four. They are the four that actually change a decision:
| Metric | What it answers | Why it matters at the portfolio level |
|---|---|---|
| Avg AI visibility | How often, across all brands, does an AI engine cite a brand in the portfolio when asked a category-relevant question? | The single number for a board slide. |
| Total mentions | How many actual AI-generated brand mentions did the portfolio earn this period? | Sanity-checks the Visibility Score — a high % over 30 responses ≠ a high % over 3,000. |
| Positive sentiment share | What % of mentions across the portfolio describe brands in positive vs. neutral vs. negative terms? | A visibility spike with collapsing sentiment is a crisis, not a win. |
| Top vs bottom delta | The gap between your best-performing brand and your worst over a fixed window. | Identifies where to redirect retainer hours next month. |
Anything beyond these four belongs in the per-brand drill-down, not the portfolio shell.
How to spot underperformers without staring at six dashboards
The pattern that works: keep two short lists visible — top performers and needs attention — and refresh them on the same cadence as the underlying scans (weekly is enough for most portfolios).
A brand belongs in Needs attention when at least one of these is true:
- Visibility Score below 20% on category-relevant prompts
- Visibility Score dropped 5+ percentage points vs. the prior window
- Sentiment ratio inverted (neutral or negative now outpaces positive)
- A previously cited domain stopped citing — usually a sign your earned-media coverage just expired
A brand belongs in Top performers when its Visibility Score is in the top tercile of the portfolio and the trend over the last two windows is flat or improving. Top-performer rotation is a useful signal in itself: brands that cycle in and out of the top list are catching ephemeral wins (a Hacker News thread, a viral post). Brands that stay in the top list are compounding.
The averaging trap — and how to avoid it
The single most common mistake in portfolio AEO is unweighted averaging. Treat this as a rule:
An AI visibility metric that doesn't weight by underlying response count is a vanity metric.
Why: a small brand can post very high Visibility Scores simply because the model has fewer competing answers in its head. Averaging that 95% next to a flagship's 45% gives you a 70% portfolio number that flatters reality. Three corrections that fix this:
- Weight rollups by response volume (the number of AI responses the brand was eligible to be mentioned in). A brand scanned across 500 prompts × 9 engines × 30 days should not be averaged equally with one scanned across 25 prompts × 1 engine.
- Show the unweighted spread alongside the average. A 15-point standard deviation across your portfolio is a story by itself.
- Show the change in the rollup, not just the level. "Portfolio +1.4pp vs. previous 30 days" is more actionable than "Portfolio 52%."
Per-engine rollups: where AI engines disagree about your portfolio
One of the most underused views in portfolio AEO is the per-engine bar across every brand you track. The reason it's underused: it looks boring. The reason it's powerful: engines disagree more than people expect.
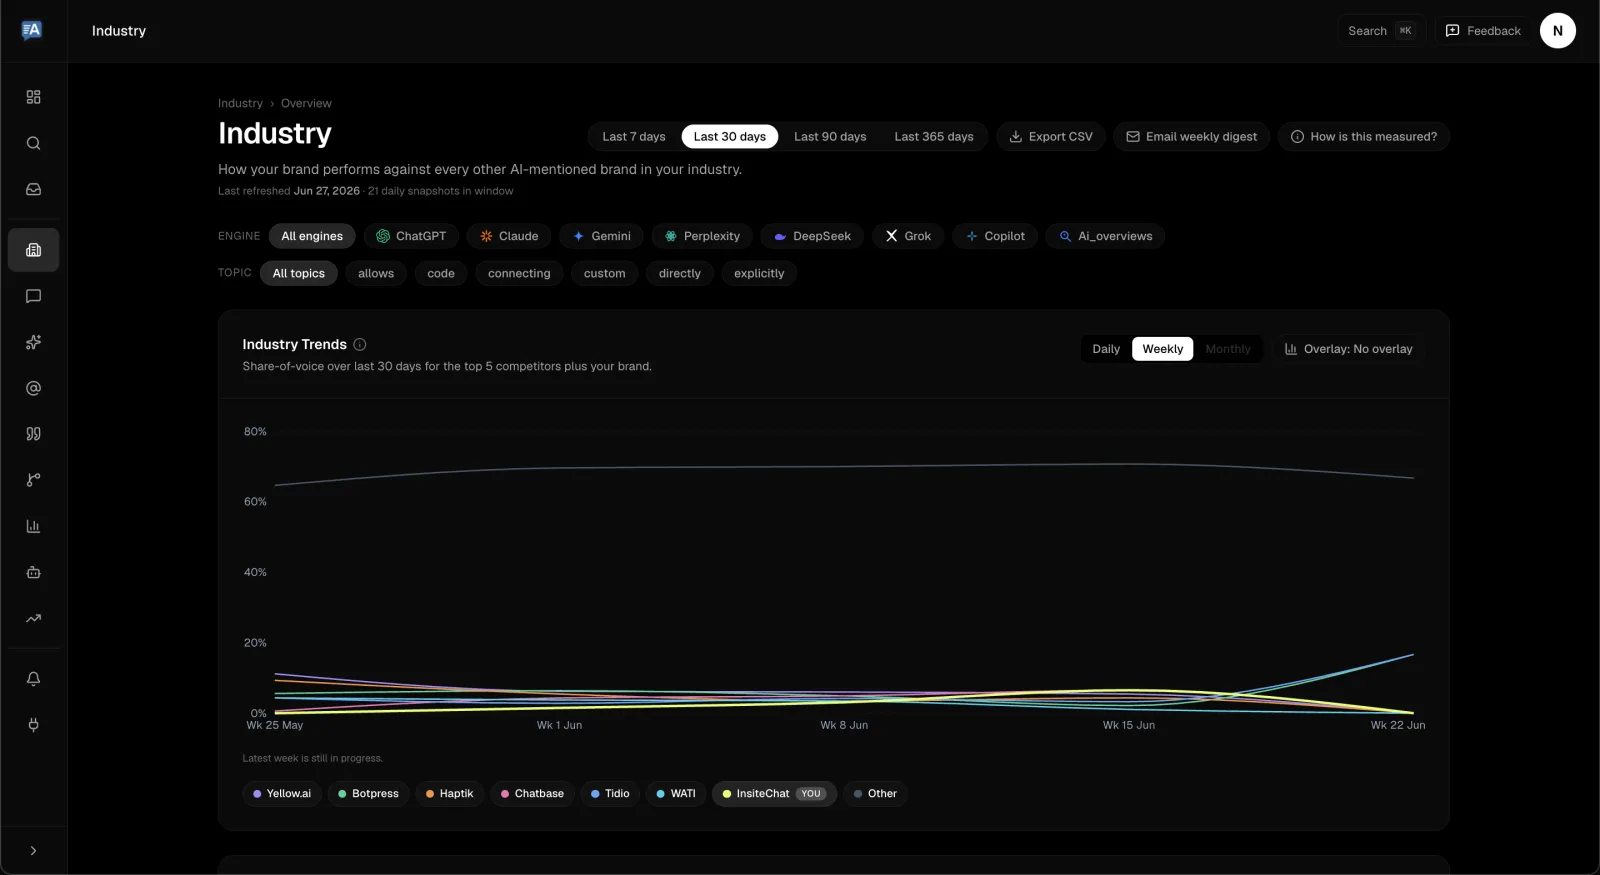
Example: share-of-voice trend for InsiteChat vs its top competitors — FixAEO.
Cross-portfolio averages we see frequently:
| Engine | Typical strongest brand profile | Typical weakest brand profile |
|---|---|---|
| ChatGPT | B2B SaaS with Wikipedia presence + comparison content | Niche consumer goods without third-party reviews |
| Claude | Technical / dev-tools brands with documentation depth | Lifestyle brands without canonical reference content |
| Perplexity | Anything with strong citation-friendly content — numbers, lists, dates | Pages without freshness markers or footnotes |
| Gemini | Brands with grounded search-result presence (still SEO-correlated) | Brands invisible in Google's top 20 SERP results |
| Copilot | Microsoft-ecosystem brands + enterprise IT | Consumer / D2C brands |
| Grok | Brands with active X/Twitter presence + recent news cycles | Brands with no real-time conversation |
If your portfolio is wildly uneven across engines, the fix is rarely "do more AEO." It's "fix the underlying content gap that one model exposes." A brand that wins on ChatGPT but loses on Perplexity is usually missing structured citation-friendly content, not visibility.
How agencies actually use portfolio AEO
Agency workflows we've watched look something like this, week to week:
- Monday — open the portfolio view. Sort by Visibility Score descending. Note any brand that crossed a threshold (above 50%, below 20%, or changed by ≥5pp).
- Tuesday — pull the Needs attention list into a client email. For each, attach the per-engine breakdown showing exactly which AI engine slipped.
- Wednesday/Thursday — execution. Whichever brand needs the biggest fix gets the bulk of retainer hours that week.
- Friday — log the changes in your account-management notes alongside the visibility delta. Over a quarter, you build a private dataset of "what we changed → what moved."
Two patterns separate the agencies that retain clients on AEO retainers from the ones that don't:
- They show the trend, not the level. Clients don't care that they're at 47%; they care that they're up 6pp from last month or down 4pp.
- They show the competitor delta, not the absolute number. "You're at 47%; your closest competitor is at 31%" is a board slide. "You're at 47%" is a number.
When you don't need a portfolio view yet
Portfolio AEO is overkill for some setups:
- Single-brand SaaS with one domain — use a per-brand dashboard.
- Pre-launch products — there's nothing to roll up until the model has reasons to mention you.
- Brands you don't actually own — competitive monitoring is a different lens (one brand from many angles, not many brands from one lens).
The default rule: if you'd open the same dashboard 3+ times to answer one question, you need a portfolio rollup. Below that, you don't.
What a good portfolio AEO setup looks like in practice
The non-negotiables, in priority order:
- One filter row at the top — date range, region/language, optional engine filter. Everything else lives below.
- Four KPI tiles — brands tracked, avg visibility, total mentions, sentiment health. With Δ vs. previous window.
- Top performers + needs-attention side-by-side — the two lists most people will look at first.
- Per-engine bar across the whole portfolio — clickable to filter the brand table below.
- A sortable, filterable brand table — one row per brand, with the same columns repeated.
- CSV export — for the inevitable "send me this in a spreadsheet" request.
If your tool gives you that shape, you have a working portfolio AEO setup. If it gives you more — alerts, time-series, dashboard share links — those are nice-to-haves, not foundations.
FixAEO's portfolio view is built on this shape. So is Profound's. The frameworks for portfolio AEO measurement are converging across tools; the differences now are in the rigor of the underlying weighting, the engine breadth, and the regional handling.
FAQ
What is portfolio AEO?
Portfolio AEO is the practice of rolling up Answer Engine Optimization metrics — Visibility Score, mentions, sentiment, per-engine breakdowns — across multiple brands, products, or clients into a single comparative view. It's how agencies, holding companies, and multi-product teams measure AI visibility without juggling separate dashboards.
How is portfolio AEO different from single-brand AEO tracking?
Single-brand AEO answers "how visible am I?" Portfolio AEO answers "which of my brands needs help first, and where is the biggest opportunity across the group?" The metrics are the same; the unit of decision-making is different.
How many brands do I need before a portfolio view is worth it?
Three or more is the practical threshold. At two brands, two browser tabs work fine. At three, you start losing comparative signal. At five, manual comparison breaks down entirely.
Should I weight portfolio averages by brand size?
Yes — weight by response volume (how many AI responses each brand was scanned across). Unweighted averages flatter small brands and obscure flagship-brand drops. This is the single most important rule in portfolio measurement.
Can I use one portfolio view for clients in different regions?
You can, but filter by region/language at the portfolio level. AI engine behaviour varies meaningfully by locale — a German brand on Gemini's de-de slot is a different question from the same brand on Gemini's en-us slot. Most serious portfolio tools (including FixAEO's portfolio page) let you set region + language as a top-level filter.
How often should I check a portfolio AEO dashboard?
Weekly is enough for most. Daily makes sense only if you're an agency reacting to live client situations or running launches. The underlying scans themselves should run more often than your check-ins — daily is ideal, weekly is the floor.1
What's the biggest mistake teams make with portfolio AEO?
Averaging unweighted. A close second: showing the level of the metric instead of the change. Both flatten signal and lead to stale decisions.
In one paragraph
Portfolio AEO tracking exists because multi-brand AI visibility is a different problem from single-brand visibility — and the failure modes (averaging unevenly, missing engine drift, fixing the loudest brand instead of the most-slipping one) are predictable. The four metrics that actually matter are average AI visibility, total mentions, sentiment share, and the top-vs-bottom delta. Weight every rollup by response volume; show change over time, not just the level; and keep "top performers" and "needs attention" lists visible so the next decision is obvious. Try a portfolio view in FixAEO — three brands is enough to feel the difference.
Footnotes
-
A reasonable starting cadence: daily LLM scans, weekly portfolio rollup, monthly trend review. See FixAEO's methodology page for the scan cadence we use. ↩
Related reading
12 Best Answer Engine Optimization Tools (2026)
12 answer engine optimization tools compared — engines covered, entry price, free tier — with honest takes on which to pick by stage and budget.
18 min readHow to measure AEO ROI: a copy-paste spreadsheet
AEO doesn't generate clicks the way Google does. Here's a concrete 4-metric framework + the spreadsheet to track ROI on every AEO investment.
13 min readHow to get cited by Perplexity: a 2026 playbook
Perplexity cites 4-8 sources per answer and the patterns are learnable. Here are the 8 we see in cited content, with copy-paste tactics.
10 min readGEO vs AEO vs SEO: a 2026 terminology breakdown
GEO, AEO, SEO — and now LLMO. A clean breakdown of what each acronym actually means, how they nest, and which one applies to your work in 2026.
9 min readHow to win back traffic lost to Google AI Overviews
Google AI Overviews run on a third of commercial queries and keep clicks in the SERP. Here are 7 changes that get your brand named in the answer.
10 min readThe 30-point AEO audit checklist (2026)
AEO audit checklist: 30 signals across 7 categories — from crawler access to per-engine verification. Copy it into Notion and run your audit today.
16 min read
Free AEO tools
Put this into practice with free FixAEO tools — no signup required.
AI Visibility Checker
Score your brand across 9 AI engines
AEO Audit Tool
Answer-engine readiness scan
Schema Generator
Build valid JSON-LD structured data
llms.txt Generator
Create a spec-compliant llms.txt
Sitemap Validator
Check your XML sitemap for errors
AI Content Grader
Grade content for AI citation readiness
See how your own site scores
FixAEO runs every check in this post automatically. Free, no signup.